Python - 小波变换

本篇随笔介绍利用 Python 实现小波变换和逆变换,并进行相关分析

小波变换计算

1
2
3
4
5
6
7
8
9
10
11
12
13
14
15
16
17
18
19
20
21
22
23
24
25
26
27
28
29
30
31
32
33
34
35
36
37
38
39
40
41
42
43
def WaveTrans(series, dt, **kwards_cwt):
import pycwt as cwt
import numpy as np

series = np.asarray(series)
std = series.std()
var = series.var()
N = len(series)
series_norm = series/std

mother = cwt.Morlet(6)
alpha, _, _ = cwt.ar1(series) # Lag-1 autocorrelation for red noise

wave, scales, freqs, coi, fft, fftfreqs = \
cwt.cwt(series_norm, dt=dt, wavelet=mother, **kwards_cwt)
power = np.abs(wave)**2 #/ scales[:, None]
periods = 1/freqs

signif, fft_theor = cwt.significance(1.0, dt=dt,
scales=scales,
sigma_test=0,
alpha=alpha,
significance_level=0.95,
wavelet=mother)
sig95 = np.ones([1, N]) * signif[:, None]
sig95 = np.abs(wave)**2 / sig95 # The power is significant where the ratio power / sig95 > 1.

glbl_power = power.mean(axis=1) * var
dof = N - scales # Correction for padding at edges
glbl_sig95, glbl_fft_theor = \
cwt.significance(var, dt=dt, scales=scales,
sigma_test=1, alpha=alpha,
significance_level=0.95,
dof=dof, wavelet=mother)

iwave = np.asarray(cwt.icwt(wave, scales, dt, wavelet=mother), float) * std

res_wt = dict(iwave=iwave, power=power,
scales=scales, periods=periods,
coi=coi, sig95=sig95,
glbl_power=glbl_power, glbl_sig95=glbl_sig95)

return res_wt

可视化

1
2
3
4
5
6
7
8
9
10
11
12
13
14
15
16
17
18
19
20
21
22
23
24
25
26
27
28
29
30
31
32
def Wave_Analysis_Plot(dat, t, dt):
import proplot as pplt

res_wt = WaveTrans(dat, dt)
iwave = res_wt['iwave']
periods = res_wt['periods']
power = res_wt['power']
sig95 = res_wt['sig95']
coi = res_wt['coi']
glbl_power = res_wt['glbl_power']
glbl_sig95 = res_wt['glbl_sig95']

fig, axes = pplt.subplots([[1, 1, 1, 1, 0],
[2, 2, 2, 2, 3]], figsize=(12, 10))
axes[0].plot(t, iwave, c='grey', lw=1.5)
axes[0].plot(t, dat, c='k', lw=2.5)
axes[1].contourf(t, periods, power)
axes[1].contour(t, periods, sig95, colors='k', vmin=1, vmax=1)
axes[1].plot(t, coi, c='k', lw=3)

axes[2].plot(glbl_power, periods, c='k', lw=2)
axes[2].plot(glbl_sig95, periods, c='grey', ls='--', lw=2)

axes[0].format(ylabel='Data')
axes[2].format(xlabel='Power')
axes[0:2].format(xlabel='Time')
axes[1:3].format(ylabel='Periods', yscale='log',
yticks=2**np.arange(1, int(np.log2(coi.max()))),
ylim=(coi.max()*1.1, periods[0]))
pplt.show()

return res_wt

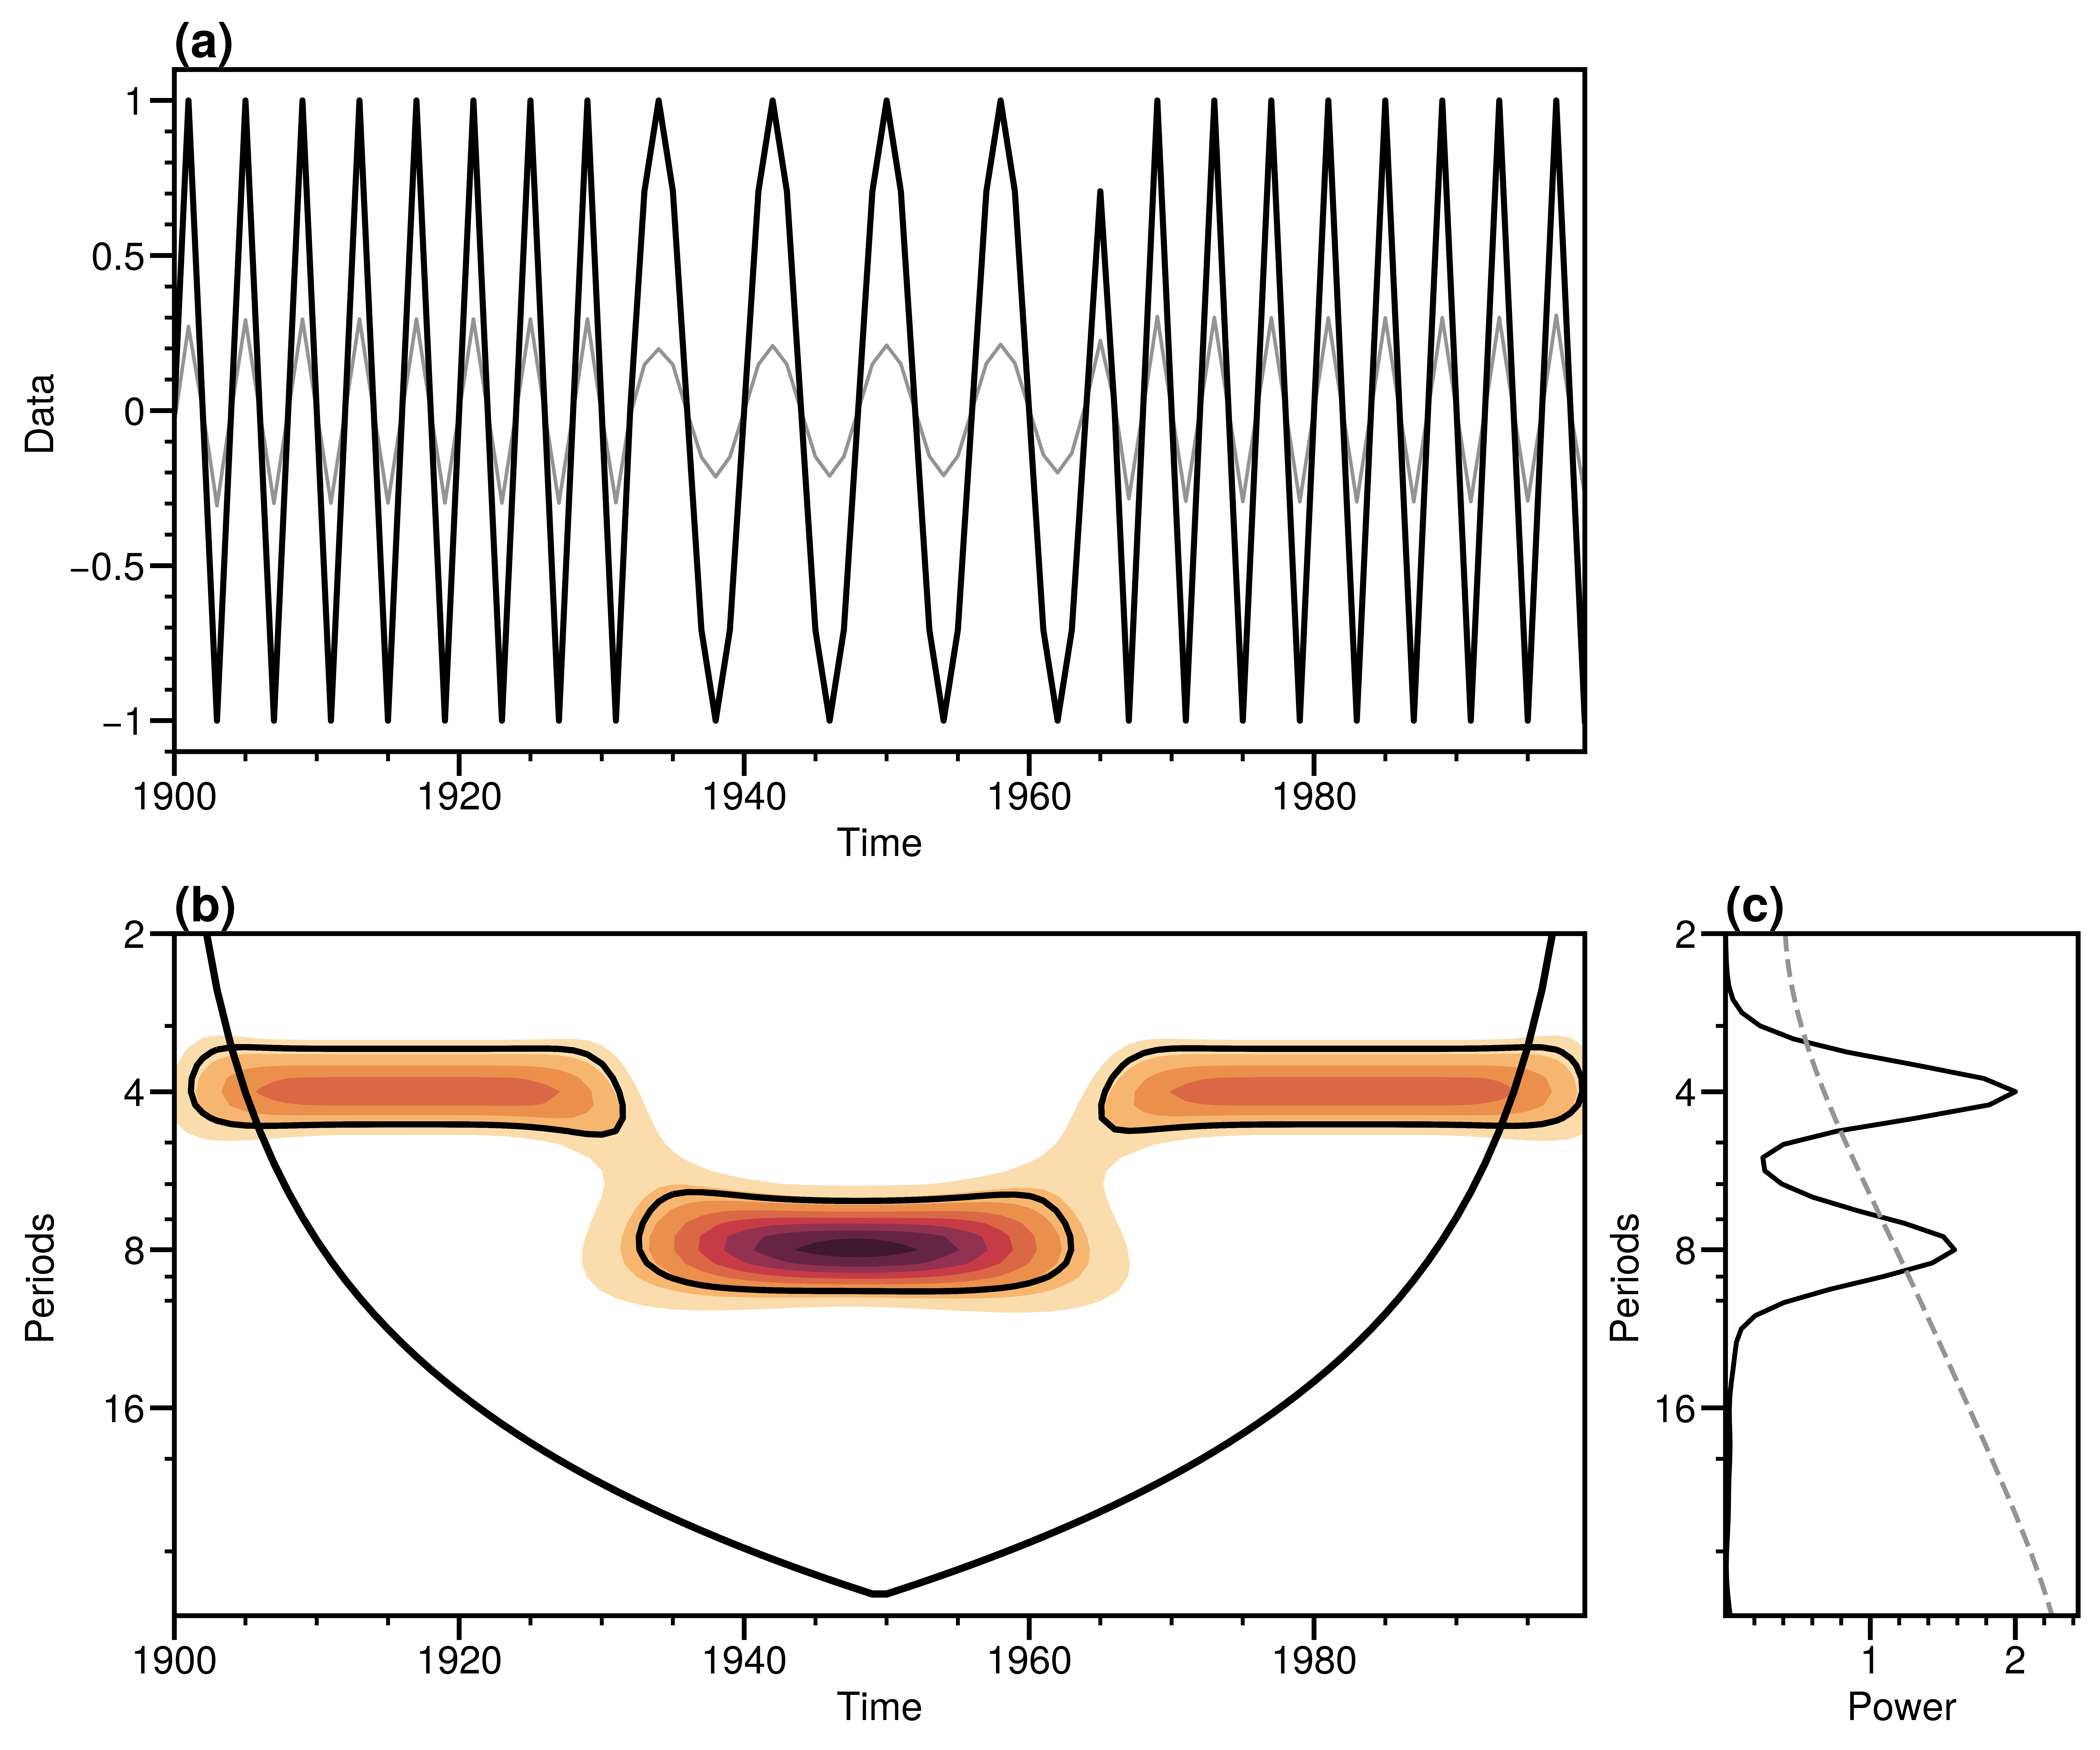
例子

1
2
3
4
5
6
7
8
dt = 1
year = np.arange(1900, 2000, dt)
dat = np.concatenate(
[np.sin(np.arange(int(year.size/3))*np.pi/2),
np.sin(np.arange(int(year.size/3), int(year.size/3*2))*np.pi/4),
np.sin(np.arange(int(year.size/3*2), int(year.size))*np.pi/2)])

res_wt = Wave_Analysis_Plot(dat, year, dt)

FIG

References

https://pycwt.readthedocs.io/en/latest/
https://github.com/chris-torrence/wavelets
https://pywavelets.readthedocs.io/en/latest/