这篇随笔主要介绍利用 Matplotlib 和 Seaborn 绘制基本图像,包括折线图、条形图、直方图、密度图、散点图、散步矩阵图等;最后还简单介绍了 Seaborn 分面网格的功能
1
2
3
4
| import pandas as pd
import numpy as np
import matplotlib.pyplot as plt
import seaborn as sns
|
obj.plot( use_index, xlim, xticks, xlabel, rot, logy, figsize, label, legend, title, kind, style, alpha, grid, ax )
use_index : 是否将对象索引用作刻度标签
xlim : x轴界限, xticks : x轴刻度值, xlabel : x轴名称
logy : 是否在y轴使用对数标尺( log(p) → h )
label, legend : 图例
kind : 控制画图种类, 如: 'line', 'bar', 'barh', 'kde'
style : 控制画图属性, 如: 'ko--'
grid : 是否显示网格线
ax : 指定要在其上进行绘制的 subplot 对象
1
2
3
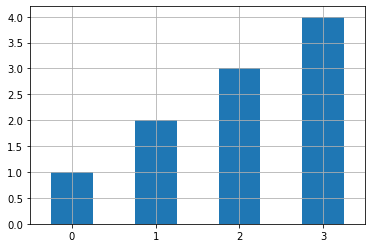
| fig, axes = plt.subplots(1,1)
s = pd.Series(np.array([1,2,3,4]))
s.plot(kind='bar', grid=True, rot=0)
|
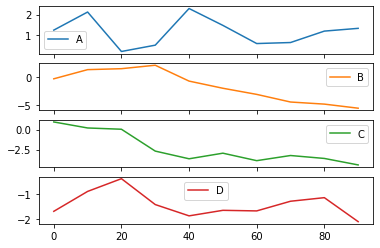
frame.plot( ... ..., subplots, sharex, sharey, sortcolumns )
subplots : 是否将 frame 各列单独绘制
sharex : subplots=True : 是否共用一个 x 轴, sharey : subplots=True : 是否共用一个 y 轴
sort_columns : 是否以字母表顺序绘制各列
1
2
3
4
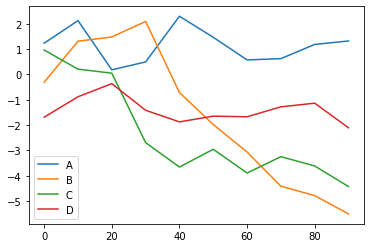
| df = pd.DataFrame(np.random.randn(10, 4).cumsum(0),
columns=['A', 'B', 'C', 'D'],
index=np.arange(0, 100, 10))
df.plot()
|
1
2
| array([<AxesSubplot:>, <AxesSubplot:>, <AxesSubplot:>, <AxesSubplot:>],
dtype=object)
|
frame.plot.line( ... ... ) : 折线图
1
2
3
4
5
6
7
8
| fig, axes = plt.subplots(2, 1)
fig.subplots_adjust()
data = pd.DataFrame(np.random.rand(6, 4),
index=['one', 'two', 'three', 'four', 'five', 'six'],
columns=pd.Index(['A', 'B', 'C', 'D'],
name='Genus'))
data.plot.bar(ax=axes[0])
data.plot.line(ax=axes[1])
|
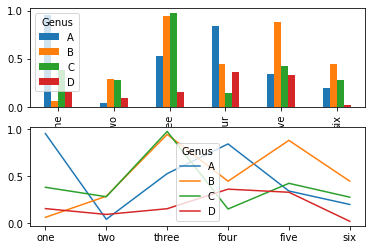
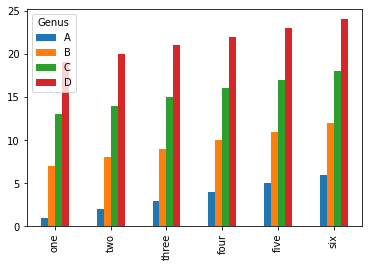
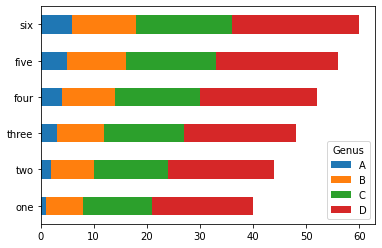
frame.plot.bar( stacked, ... ), frame.plot.barh( stacked, ... ) : 条形图
1
2
3
4
5
| data = pd.DataFrame(np.arange(1,25).reshape(4, 6).T,
index=['one', 'two', 'three', 'four', 'five', 'six'],
columns=pd.Index(['A', 'B', 'C', 'D'],
name='Genus'))
data
|
| Genus | A | B | C | D |
|---|
| one | 1 | 7 | 13 | 19 |
|---|
| two | 2 | 8 | 14 | 20 |
|---|
| three | 3 | 9 | 15 | 21 |
|---|
| four | 4 | 10 | 16 | 22 |
|---|
| five | 5 | 11 | 17 | 23 |
|---|
| six | 6 | 12 | 18 | 24 |
|---|
1
2
| data.plot.bar()
data.plot.barh(stacked=True)
|
sns.barplot( data, x, y, hue, orient ) : 平均值及置信度
1
2
| tips = pd.read_csv('pydata-book-2nd-edition/examples/tips.csv')
tips.head()
|
| total_bill | tip | smoker | day | time | size |
|---|
| 0 | 16.99 | 1.01 | No | Sun | Dinner | 2 |
|---|
| 1 | 10.34 | 1.66 | No | Sun | Dinner | 3 |
|---|
| 2 | 21.01 | 3.50 | No | Sun | Dinner | 3 |
|---|
| 3 | 23.68 | 3.31 | No | Sun | Dinner | 2 |
|---|
| 4 | 24.59 | 3.61 | No | Sun | Dinner | 4 |
|---|
1
2
| tips['tip/total_bill'] = tips['tip'] / tips['total_bill']
sns.barplot(data=tips, x='tip/total_bill', y='day', orient='h')
|
1
2
3
4
5
6
7
8
9
10
11
| <AxesSubplot:xlabel='tip/total_bill', ylabel='day'>
````

#
```python
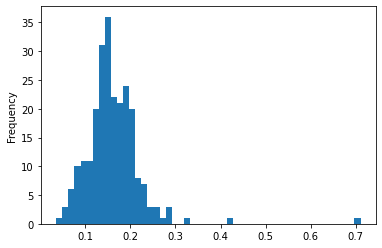
tips = pd.read_csv('pydata-book-2nd-edition/examples/tips.csv')
tips['tip/total_bill'] = tips['tip'] / tips['total_bill']
tips.head()
|
| total_bill | tip | smoker | day | time | size | tip/total_bill |
|---|
| 0 | 16.99 | 1.01 | No | Sun | Dinner | 2 | 0.059447 |
|---|
| 1 | 10.34 | 1.66 | No | Sun | Dinner | 3 | 0.160542 |
|---|
| 2 | 21.01 | 3.50 | No | Sun | Dinner | 3 | 0.166587 |
|---|
| 3 | 23.68 | 3.31 | No | Sun | Dinner | 2 | 0.139780 |
|---|
| 4 | 24.59 | 3.61 | No | Sun | Dinner | 4 | 0.146808 |
|---|
1
| tips['tip/total_bill'].plot.hist(bins=50)
|
1
| <AxesSubplot:ylabel='Frequency'>
|
1
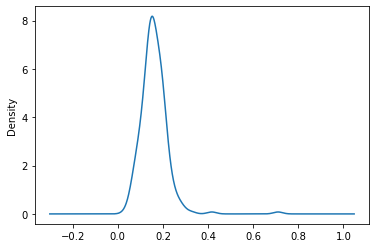
| tips['tip/total_bill'].plot.density()
|
1
| <AxesSubplot:ylabel='Density'>
|
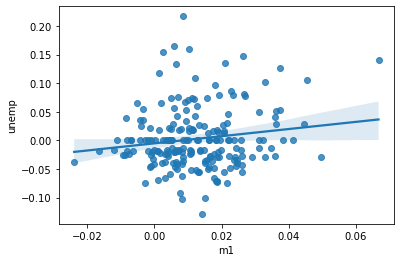
sns.regplot( data, x, y, hue ) : 散点图
1
2
3
4
5
| macro = pd.read_csv('pydata-book-2nd-edition/examples/macrodata.csv')
data = macro[['cpi', 'm1', 'tbilrate', 'unemp']]
trans_data = np.log(data).diff().dropna()
trans_data.head()
sns.regplot(x = 'm1', y = 'unemp', data=trans_data)
|
1
| <AxesSubplot:xlabel='m1', ylabel='unemp'>
|
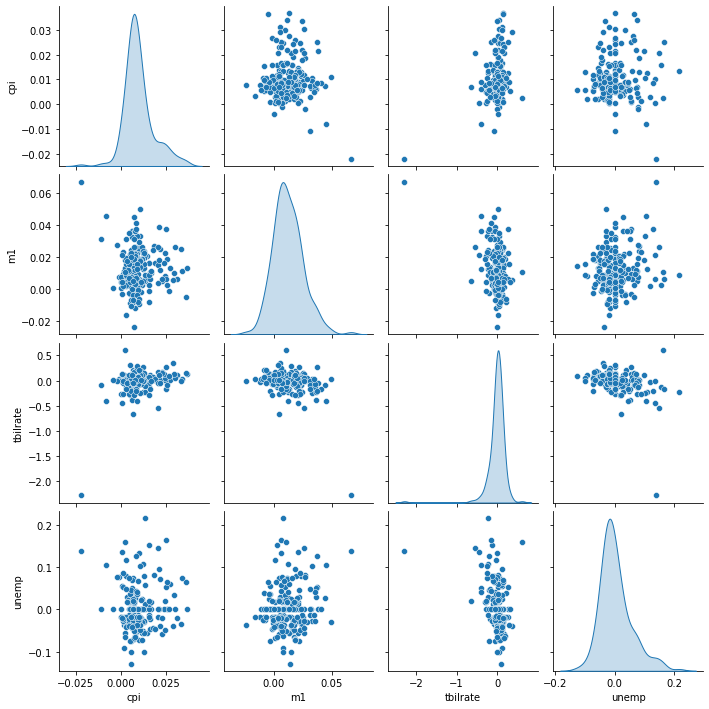
sns.pairplot( data, diag_kind, plot_kws ) : 散步图矩阵
1
| sns.pairplot(trans_data, diag_kind='kde')
|
1
| <seaborn.axisgrid.PairGrid at 0x2244980c220>
|
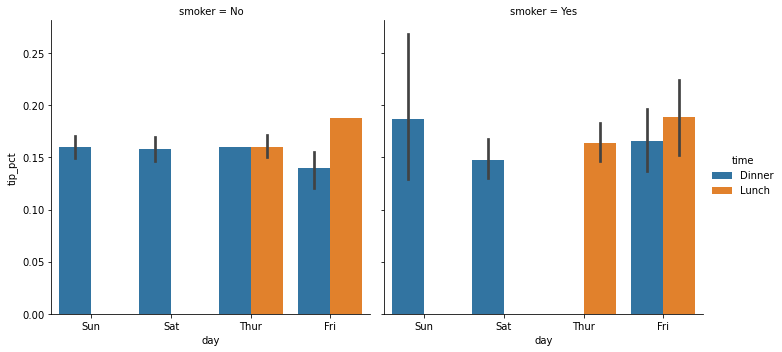
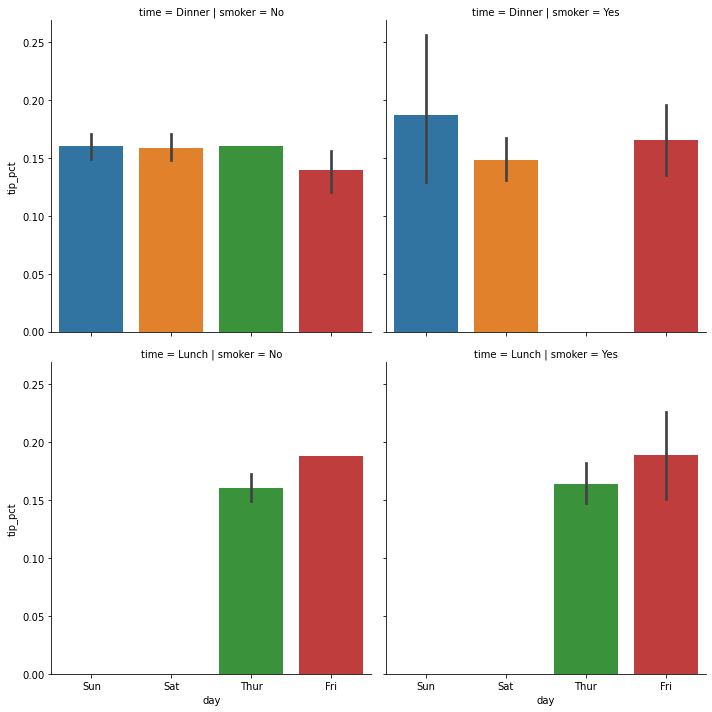
sns.catplot( data, x, y, hue, row, col, kind ) : 分面网格
1
2
3
4
| tips = pd.read_csv('pydata-book-2nd-edition/examples/tips.csv')
tips['tip_pct'] = tips['tip'] / tips['total_bill']
sns.catplot(x='day', y='tip_pct', hue='time', col='smoker',
kind='bar', data=tips)
|
1
| <seaborn.axisgrid.FacetGrid at 0x224497158b0>
|
1
2
3
| sns.catplot(x='day', y='tip_pct', row='time',
col='smoker',
kind='bar', data=tips)
|
1
| <seaborn.axisgrid.FacetGrid at 0x2244a232370>
|
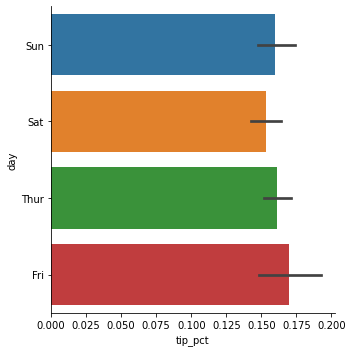
1
2
| sns.catplot(x='tip_pct', y='day', kind='bar',
data=tips[tips.tip_pct < 0.5])
|
1
| <seaborn.axisgrid.FacetGrid at 0x2244a653100>
|
1
2
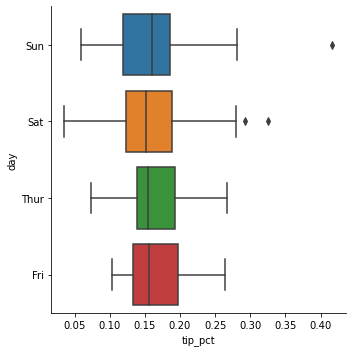
| sns.catplot(x='tip_pct', y='day', kind='box',
data=tips[tips.tip_pct < 0.5])
|
1
| <seaborn.axisgrid.FacetGrid at 0x2244a830af0>
|